> ## Documentation Index
> Fetch the complete documentation index at: https://docs.generalrobotics.dev/llms.txt
> Use this file to discover all available pages before exploring further.
# Metric3D
> Metric monocular depth estimation and surface normal prediction using Metric3D ViT-Large
Estimate metric depth and surface normals from a single RGB image using Metric3D ViT-Large. Returns both a depth map in meters and per-pixel unit surface normals.
## Parameters
RGB image as file path, URL, PIL Image, or numpy array.
Optional timeout in seconds for the HTTP request.
## Returns
`dict` with two keys:
* **`depth`** — `np.ndarray` of shape `(H, W)` with dtype `float32`. Metric depth in meters.
* **`normals`** — `np.ndarray` of shape `(H, W, 3)` with dtype `float32`. Unit surface normals (x, y, z).
## Example Output
### Depth
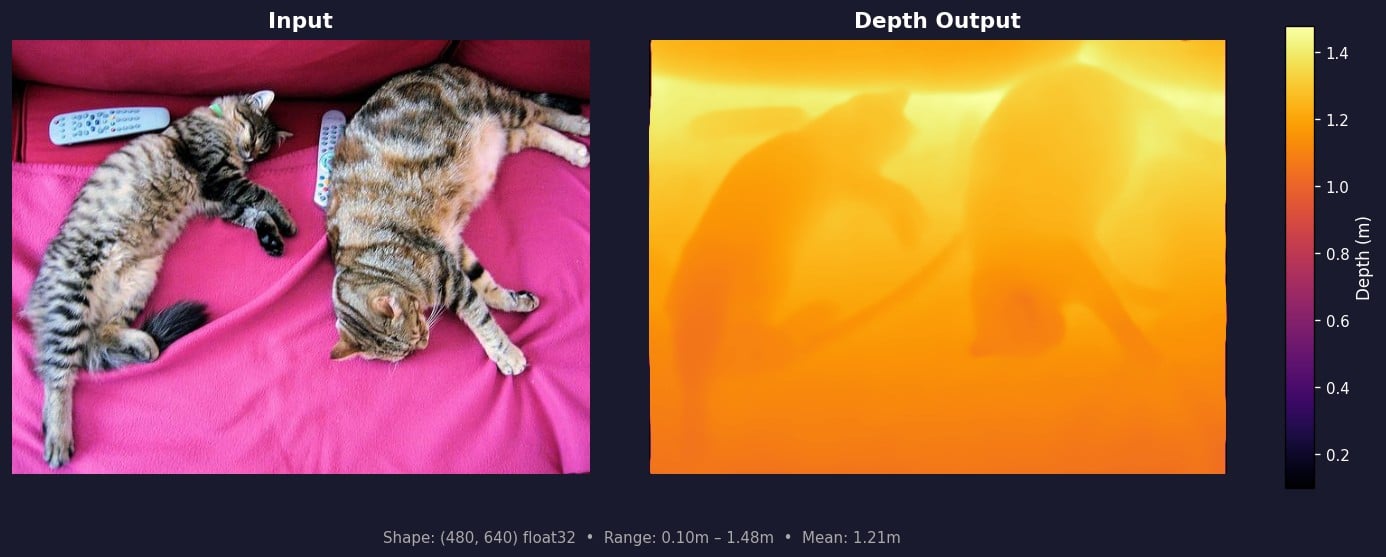 The depth map contains per-pixel metric distance in meters. Brighter regions (yellow/white) are farther from the camera; darker regions (purple/black) are closer. Values are absolute metric depth — larger values mean greater distance, and you can directly compare values across different images.
### Surface Normals
The depth map contains per-pixel metric distance in meters. Brighter regions (yellow/white) are farther from the camera; darker regions (purple/black) are closer. Values are absolute metric depth — larger values mean greater distance, and you can directly compare values across different images.
### Surface Normals
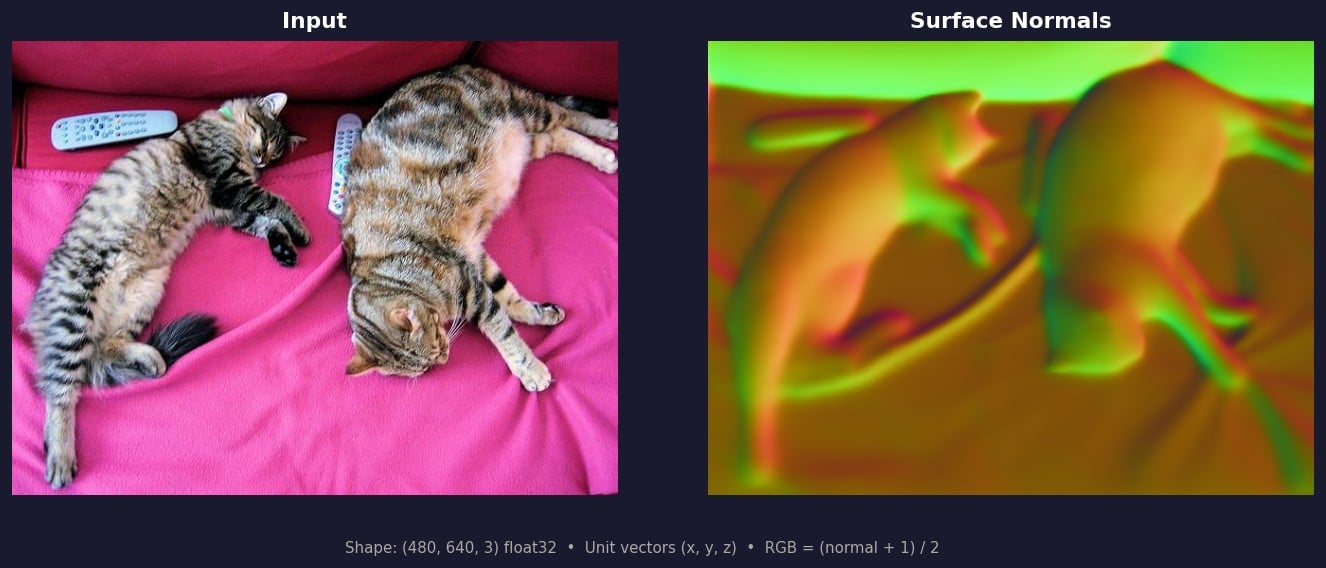 Surface normals represent the direction each surface faces as a unit vector `(x, y, z)`. In the RGB visualization, each channel maps to an axis: **red = +x** (right), **green = +y** (down), **blue = +z** (away from camera). Flat surfaces appear as uniform color; edges and curves show color transitions. Normals are mapped to RGB as `(normal + 1) / 2 * 255` for display.
## Example
```python theme={null}
from grid_cortex_client import CortexClient
from PIL import Image
client = CortexClient()
image = Image.open("scene.jpg") # 640x480 RGB
result = client.run(model_id="metric3d", image_input=image)
depth = result["depth"]
normals = result["normals"]
print(depth.shape, depth.dtype)
# (480, 640) float32
print(f"depth: min={depth.min():.3f}, max={depth.max():.3f}, mean={depth.mean():.3f} (meters)")
# depth: min=0.100, max=1.478, mean=0.621 (meters)
print(normals.shape, normals.dtype)
# (480, 640, 3) float32
# Visualize normals as RGB: map [-1, 1] to [0, 255]
normals_vis = ((normals + 1) / 2 * 255).clip(0, 255).astype("uint8")
Image.fromarray(normals_vis).save("normals_vis.png")
```
Surface normals represent the direction each surface faces as a unit vector `(x, y, z)`. In the RGB visualization, each channel maps to an axis: **red = +x** (right), **green = +y** (down), **blue = +z** (away from camera). Flat surfaces appear as uniform color; edges and curves show color transitions. Normals are mapped to RGB as `(normal + 1) / 2 * 255` for display.
## Example
```python theme={null}
from grid_cortex_client import CortexClient
from PIL import Image
client = CortexClient()
image = Image.open("scene.jpg") # 640x480 RGB
result = client.run(model_id="metric3d", image_input=image)
depth = result["depth"]
normals = result["normals"]
print(depth.shape, depth.dtype)
# (480, 640) float32
print(f"depth: min={depth.min():.3f}, max={depth.max():.3f}, mean={depth.mean():.3f} (meters)")
# depth: min=0.100, max=1.478, mean=0.621 (meters)
print(normals.shape, normals.dtype)
# (480, 640, 3) float32
# Visualize normals as RGB: map [-1, 1] to [0, 255]
normals_vis = ((normals + 1) / 2 * 255).clip(0, 255).astype("uint8")
Image.fromarray(normals_vis).save("normals_vis.png")
```